Number of Stops by Month
Stops by Month
This line chart displays the total number of stop-and-frisk incidents recorded each month of 2023. The data shows a gradual increase over time, culminating in a noticeable peak in October, which recorded the highest number of stops at 1,734. This spike highlights a significant surge in activity during that period.
Number of Stops by Race Description
Stops by Race
This bar chart shows police stops by race, with People of Color (POC) highlighted in red. The data reveals a clear disparity—POC are stopped more often than white individuals, with Black individuals facing the highest stop rate by far.
Legend
- 1 - Black
- 2 - White Hispanic
- 3 - Black Hispanic
- 4 - White
- 5 - Asian / Pacific Islander
- 6 - Middle Eastern/Southwest Asian
- 7 - American Indian/Alaskan Native
Stop Locations by Race Description
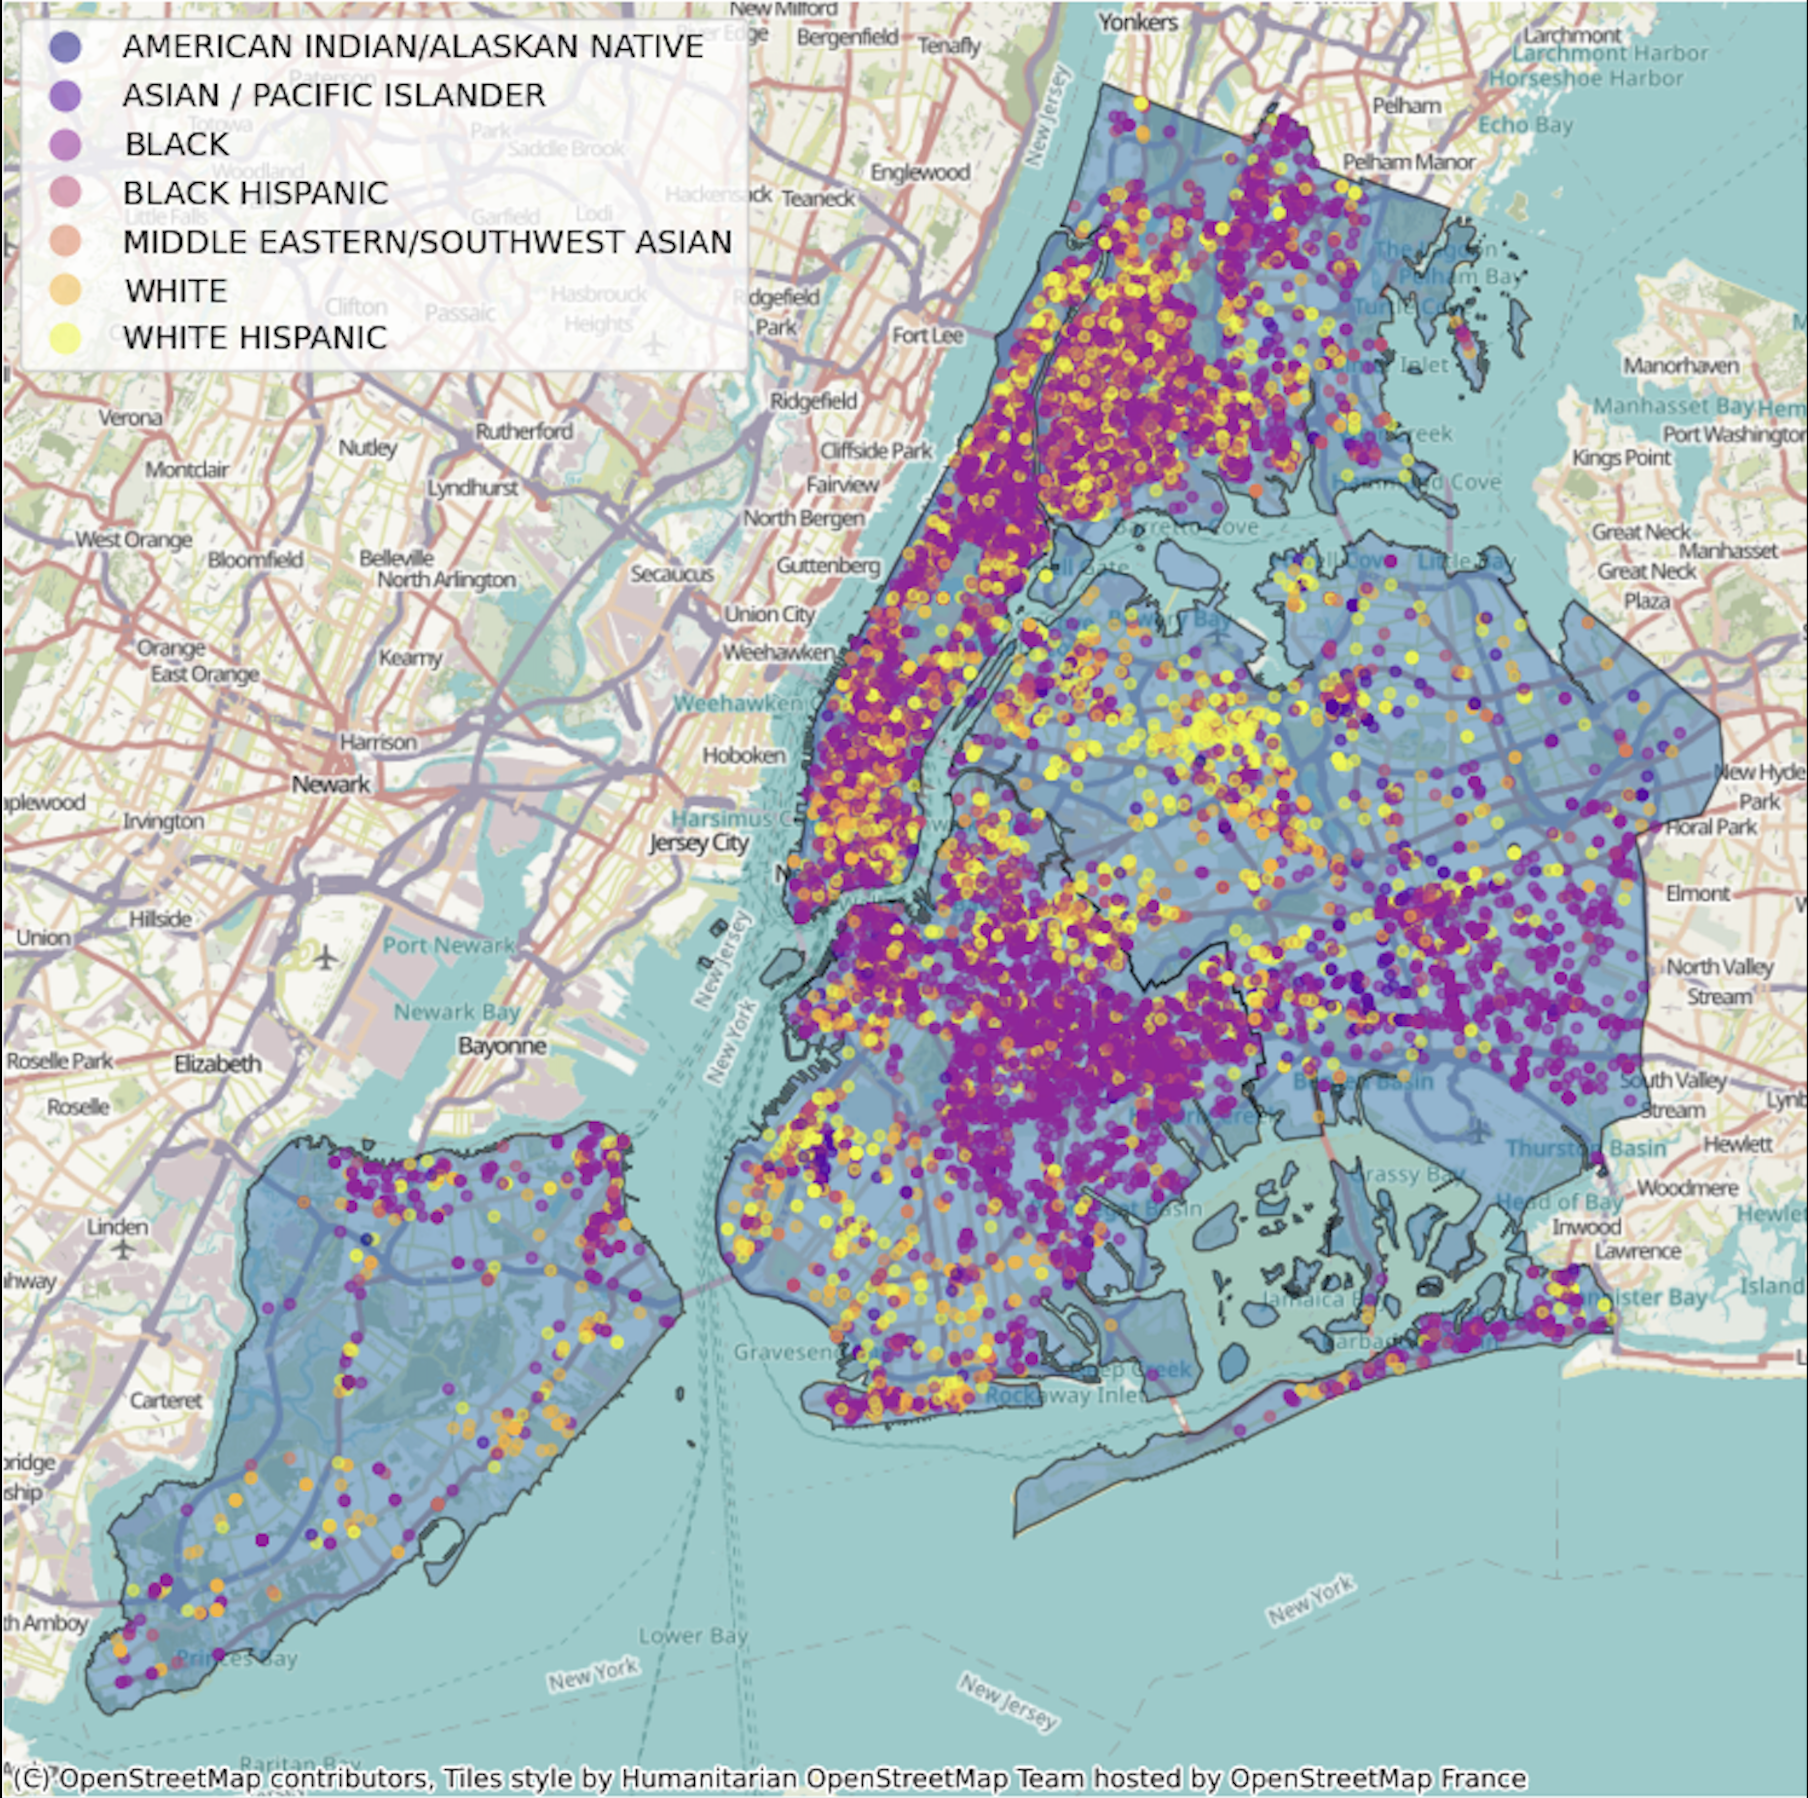
NYC Stop Map
by Race
This map plots every recorded police stop across NYC, with each point color-coded by the race of the person stopped. Black individuals are overwhelmingly represented, making up the majority of stop locations throughout the city.
Racial Disparity in Police Stops by Borough
| Rank | Borough | Ratio |
|---|---|---|
| 1 | Staten Island | 1.78 |
| 2 | Brooklyn | 1.48 |
| 3 | Manhattan | 1.36 |
| 4 | Queens | 1.20 |
| 5 | Bronx | 1.08 |
Stop vs Pop
This table ranks the five NYC boroughs based on the ratio of POC stop percentage to POC population percentage. A higher ratio indicates greater disparity—where People of Color are stopped at rates far exceeding their representation. Staten Island ranks highest, with a ratio of 1.78, suggesting the most disproportionate policing.
Where does the data come from?
Data is sourced from the U.S. Census and the NYC Stop-and-Frisk dataset. Ratios were calculated by dividing the percentage of stops involving POC by the POC population percentage in each borough.
View the original data:
Stop Outcomes
Stop Outcomes
This section visualizes what happened after police stops — whether individuals were frisked, arrested, or if a weapon was found. Around 35% of stops led to frisks, but few uncovered weapons or resulted in arrests.
Use the buttons to switch between outcomes.